How Regional Economic Fluctuations Shape Wagering Volume Patterns Across State-Licensed Digital Platforms
Written by Ines Günther · Jul 2, 2026
How Regional Economic Fluctuations Shape Wagering Volume Patterns Across State-Licensed Digital Platforms
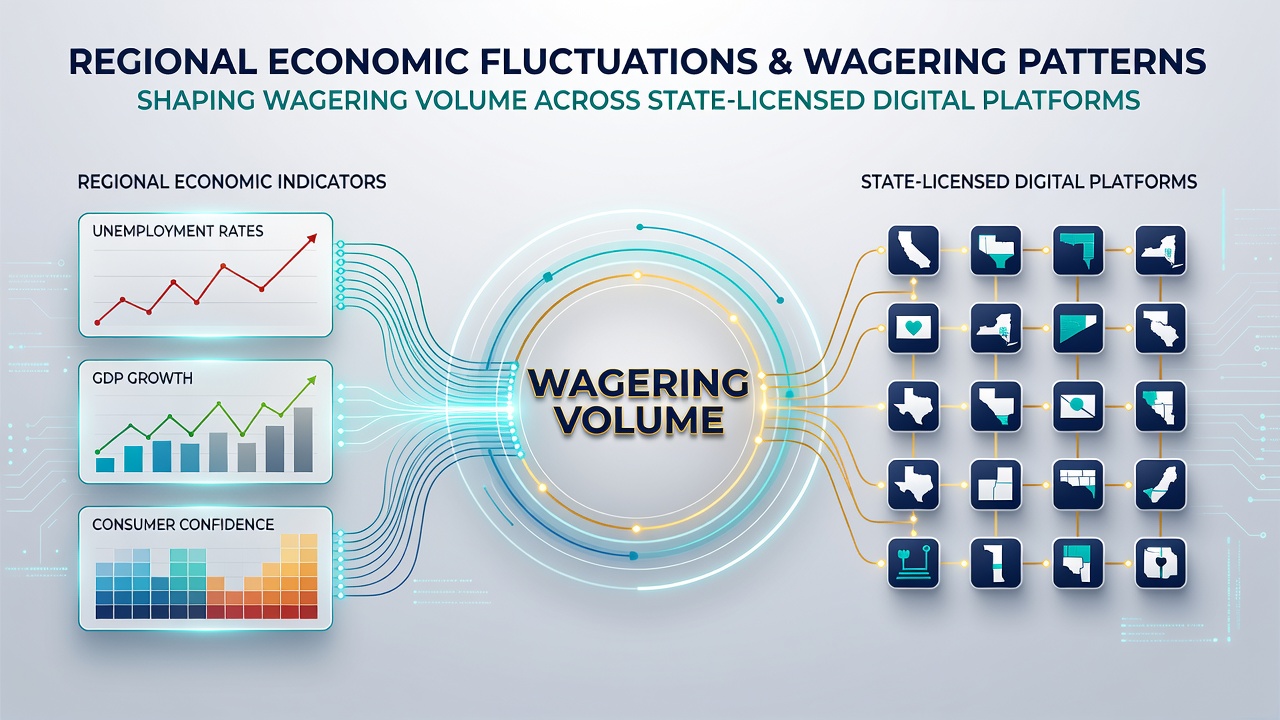
Economic conditions in specific regions exert direct pressure on how much activity occurs on state-licensed digital wagering platforms, and data collected through mid-2026 illustrates clear connections between local job markets, wage growth, and betting volumes. When unemployment rises in a state, for instance, residents often adjust discretionary spending, which includes online wagers placed through regulated apps and websites. Conversely, periods of wage increases or manufacturing rebounds tend to coincide with measurable upticks in handle across those same platforms.
Key Economic Indicators and Their Direct Ties to Betting Activity
State-level reports track several metrics that correlate with digital wagering patterns, including changes in personal income, consumer confidence indices, and sector-specific employment figures. Research from the National Bureau of Economic Research shows that a 1 percent drop in regional employment often produces a corresponding decline in monthly handle on licensed sportsbooks and casino platforms within three to six months. Those same studies note that states experiencing energy sector recoveries, such as parts of Pennsylvania and Ohio, recorded handle growth exceeding 8 percent during the first half of 2026.
Disposable income serves as the primary channel through which these fluctuations reach digital operators. When payrolls in automotive or logistics hubs contract, users reduce both frequency and average stake size on mobile apps. Platform operators have documented these shifts through internal analytics that segment users by zip code, revealing tighter clustering of reduced activity in counties hit hardest by layoffs.
State-Specific Patterns Emerging in 2026
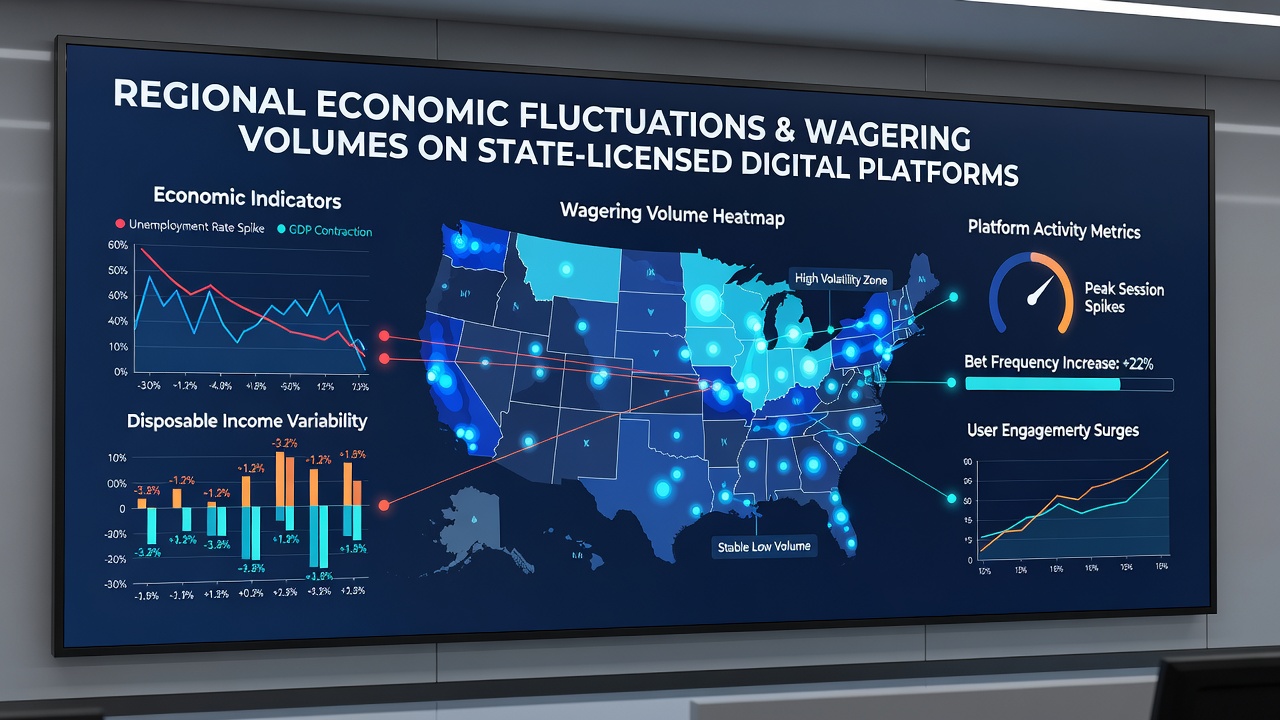
July 2026 data from multiple jurisdictions highlights divergent trajectories. Michigan saw modest handle contraction in digital channels after auto plant slowdowns reduced overtime hours, while neighboring Indiana posted gains tied to pharmaceutical and distribution employment gains. Observers tracking these markets point to real-time dashboards maintained by state gaming agencies that publish weekly handle totals broken down by county, allowing direct comparison against unemployment claims filed in the same areas.
Similar contrasts appear in the Northeast. New Jersey operators recorded steady volume despite national economic headwinds, partly because finance and healthcare employment remained stable in the state. In contrast, upstate New York counties with heavier manufacturing footprints showed slower recovery in online handle following earlier downturns. These regional differences underscore how localized labor market conditions translate into distinct usage curves on the same national platforms.
Platform Adjustments and User Behavior Responses
Operators respond to these regional signals by tweaking promotions and interface elements. In areas showing income contraction, platforms increase the visibility of lower-stake options and cash-back offers while reducing exposure to high-volatility games. Data shared at industry conferences indicates that retention rates improve when these targeted adjustments align with local economic calendars, such as aligning bonus releases with regional tax refund periods or seasonal hiring cycles.
User segmentation by payment method also reveals economic sensitivity. Credit card deposits tend to hold steadier in affluent counties, whereas e-wallet and prepaid card activity fluctuates more sharply with weekly paycheck cycles in regions experiencing volatility. Analysts at research institutions such as the University of Nevada, Reno have mapped these payment patterns against Bureau of Labor Statistics releases, confirming that deposit method serves as a leading indicator of broader volume shifts.
Regulatory Data Sources and Cross-Border Comparisons
State gaming control boards compile monthly reports that enable these correlations. Figures released by the Michigan Gaming Control Board and the Indiana Gaming Commission in July 2026 provided county-level breakdowns that researchers cross-referenced with employment statistics from the same period. Similar datasets from the Australian wagering sector, published through state regulatory portals, show parallel relationships between mining region downturns and online betting volumes, offering comparative context for U.S. observers.
These public records allow independent verification without relying on operator self-reporting alone. Academic teams have begun publishing working papers that merge gaming commission spreadsheets with Census Bureau income data, producing regression models that isolate economic variables from marketing or product changes. The resulting coefficients consistently assign between 35 and 50 percent of volume variance to regional economic factors.
Conclusion
Regional economic fluctuations continue to drive measurable differences in wagering volumes on state-licensed digital platforms, as evidenced by 2026 regulatory filings and academic analyses. Employment levels, wage trends, and sector-specific recoveries translate into distinct usage patterns that operators and regulators can track at the county level. Continued publication of granular data from multiple jurisdictions supports ongoing examination of these relationships across different economic cycles.